Ask Data – What did you expect?
Since February 13th, Tableau has allowed you to query your data directly in natural language thanks to Ask Data, its new NLP (Natural Language Processing) feature.
In our view, this represents a first step toward the democratization of analytics. Until now, it was a matter of having a data analysis expert or data scientist among your teams, the “sexiest job of the 21st century” according to the Harvard Business Review. Thanks to this new feature, there is no need for such a title or to be a skilled technician. From now on, you are capable of obtaining an analysis in just a few words.
This means exploiting a dataset through a question, a statement, or even keywords. No need for a technical vocabulary; everyday language is sufficient. Thus, you will obtain spontaneous and adapted visual analyses to respond precisely to your request.
Simple, don’t you think?
Beyond the purpose and the ease of obtaining results, several elements must be respected to use the Ask Data functionality optimally. This is what we will try to explain to you through this article.
1. Preparing your data
1.1. Select your fields
To use Ask Data, the publication of a data source is necessary. You can therefore use this functionality on Tableau Server and/or Tableau Online only (no possible use with Tableau Desktop directly).
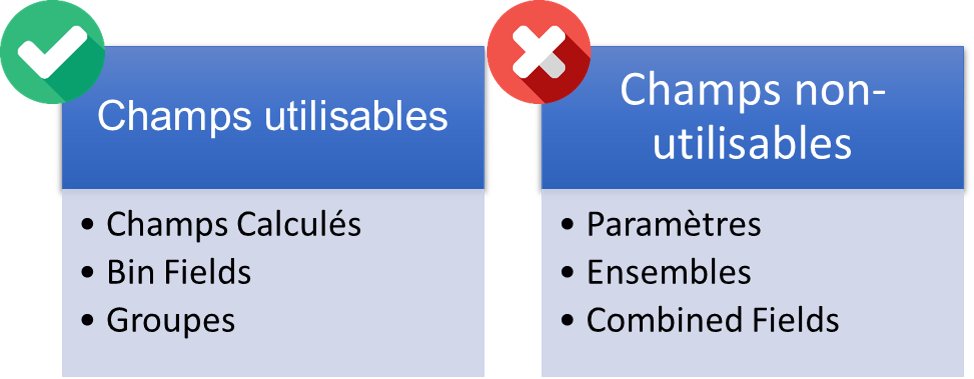
Also note all the elements of a data source not taken into account by Ask Data.
1.2. Using natural language
As we said before, to use Ask Data, you simply need to ask a question or suggest a statement. In this statement, you will be able to use one or more analytical expressions specific to Tableau.
The keywords to know for an effective statement are as follows:
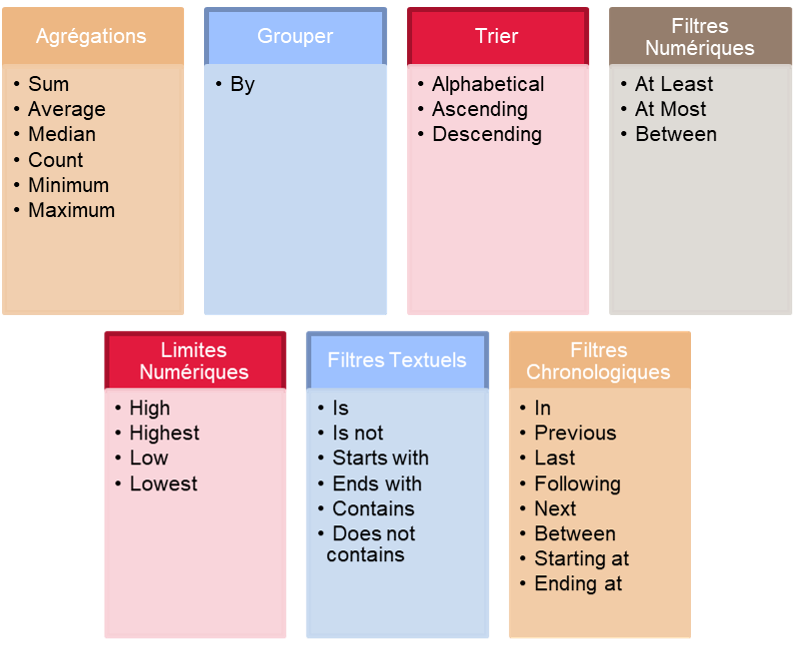
- Aggregations: By aggregations, we mean the use of “sum”, “average”, “median”, “count”, “minimum”, or “maximum”. Be aware that you can also use synonyms instead of these terms, such as “mean” for average or “cnt” for count.
- Group: Grouping is translated by the use of the term “by” (“By Region”).
- Sort: If you wish to use a sort, then your statement must be similar to “sort shops in alphabetical order”. Three sorting possibilities are available to you: “Ascending”, “Descending”, or “Alphabetical”.
- Numerical filters: To use filters properly, you must use the terms “At Least”, “At most”, or “Between”. Furthermore, you should know that the Ask Data engine is capable of suggesting a numerical value based on your statement. If, for example, you wish to display a minimum price (thus using the keywords “price” and “at least”), the search bar will suggest the minimum value available in your dataset.
- Numerical limits: By numerical limit, you should understand the possibility of displaying a “Top” or a “Bottom”. Terms like “high”, “low”, “highest”, and “lowest” are also understood in the Ask Data language.
- Text filters: In order to filter your dimension-type data, you can use:
- Is
- Is not
- Starts with
- Ends with
- Contains
- Does not contain
- Chronological filters: The last type of filter taken into account concerns date fields. For this, you can use the following terms:
- In
- Previous
- Last
- Following
- Next
- Between
- Starting at
- Ending at
Below is a summary of the language to use in your Ask Data processes.
2. Formatting your data source
In the remainder of this article, we will give you some practical advice for publishing a clean, clear, and concise dataset. This way, your end users will be able to get all the answers to their questions.
2.1. Prepare the data
To optimize your data and prepare a high-performance data source, you must anticipate end-user questions. By preparing sample statements and questions, you will better understand the content of your data source.
This is why we recommend simplifying this data source by keeping only the necessary fields. There is no need to keep unimportant or even hidden fields. Particular attention should also be given to the naming convention of your fields so that they are unique and easily identifiable by all users.
Furthermore, do not forget to grant access to end users; otherwise, Ask Data will not be usable.
2.2. Setting up data types and their formats
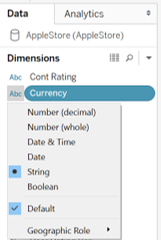
Each field in your data source must be configured beforehand before being used via Ask Data. This means you must determine if your dimensions are strings, numbers, locations, or dates. Regarding measures, you must prepare the aggregation function (sum for sales, for example). This will significantly optimize the acquisition of meaningful results for your users.
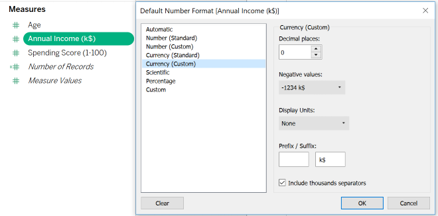 In terms of format and with the aim of facilitating statements, it is recommended that you choose the right number formats to meet all types of needs (minimum/maximum vs. cheaper/more expensive). Also pay attention to the units of your data source (€, K€, M€).

2.3. Organize your data into hierarchies
This applies particularly to date data (Years, Months, Day) or geolocation data (Countries, Regions, Cities). The same applies to functionally dependent dimensions (category and subcategories, for example). The end user will thus have access to drill-down within each visualization.
2.4. Create “bin fields”
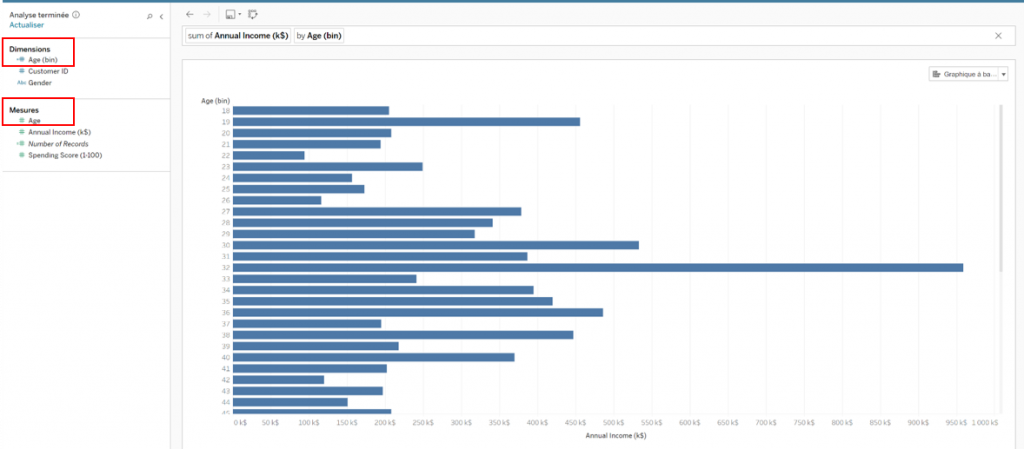
These fields are interesting when it comes to transforming a measure into a dimension. Let’s take the example of a measure such as age. This initially numerical field could be analyzed in the form of a graph. So we will create a copy of this field and transform it into a dimension to perform analyses with this dimension, as illustrated in the image below.
2.5. Control of names and geographic identifications
In order not to mislead your end user and to facilitate a good experience, most of your titles and labels must be controlled. This is relatively important in the context of geographic data. A single character can sometimes change the interpretation of a value. For fields with a shortened title, do not hesitate to use a more complete label. Keep in mind that end users do not necessarily have the same vocabulary (example: “CustID” can become “Customer ID”). Moreover, we recommend using synonyms (methodology given later) to anticipate the use of other terms to display a specific dimension or measure.
On the other hand, it is not recommended to use names that are too technical or precise for a piece of data. Example: “sales in 2015”. This can compromise the chances of results. To obtain this result, it is possible, for example, to use a sum-type aggregation and a date filter on your “sales” measure.
Finally, Tableau offers a standard field of the type “number of xxx”. To optimize the user experience, do not hesitate to rename this field to provide more precision on the content of your dataset.
In general, Ask Data anticipates your statement and will make suggestions among fields containing a similar term, using an appropriate aggregation or filter.
2.6. Creation of calculated fields
The use of Ask Data does not allow for the creation of calculated fields on the fly. This is why we recommend anticipating their creation to enrich your data source and thus cover as many end-user statements and/or questions as possible. This involves, for example, calculating rates and ratios (margin rate, % turnover) or even amounts including tax if you only have the pre-tax amount. Of course, do not add calculated fields at every turn; your database must remain healthy and specific.
2.7. Enhance your dictionary of synonyms
The user will probably not have the same vocabulary as you. To compensate for this, you have the possibility to strengthen the language by adding synonyms. This will allow you to display optimal and, above all, consistent responses based on different requests. In terms of procedure, simply click on the black arrow of a specific field in your dataset, then click on “edit synonyms”. You can add as many as you want as long as you separate them with a comma!
Conclusion:
As you have understood, Tableau is introducing a new era in analytics and data analysis thanks to Ask Data. This tool is not only useful for answering questions but also for creating visualizations for your dashboards with a simple request.
To date, only English is supported, but Ask Data will very soon handle new languages, including French. Voice recognition, however, is not available.
Are you ready to move to Intelligent BI?
MeltOne Advisory, through its Data & Analytics experts, can support you from scoping to the implementation of Tableau. If you have any questions, please do not hesitate to contact us by email: jsaccona@meltone.com.
Let’s discuss your challenges and our solutions
Let’s talk about your project and discover how MeltOne can turn your challenges into concrete, high-performing solutions.