Compass Feature: Risk Analysis with Monte Carlo Simulation (SAC Machine Learning Accessible to End Users)
Since Q1 2025, SAP Analytics Cloud has offered a powerful and accessible new feature: Compass. It democratizes the use of machine learning by making Monte Carlo simulation available to all users, without any need for code or advanced mathematical skills. Easy to use, intuitive, and integrated into the SAC environment, this feature aims to make uncertainty management more tangible, more visual… and more strategic.
1. What is the Monte Carlo Simulation Used in Compass?
Monte Carlo simulation is a mathematical method that calculates the probable outcomes of uncertain events. Far from being a game of chance, this structured approach provides better understanding of scenario variability by generating a distribution of possible results.
By replacing point estimates with probability distributions, decision-makers can assess risks, identify areas of critical uncertainty, and thus make more informed decisions.
2. What Are the Objectives of Compass?
Compass was designed to make this type of analysis accessible to all users, whether technical or business-oriented. No lines of code, no need for IT configuration, no data duplication or complex formulas: everything is done by clicking. Adoption is immediate.
The solution enables:
- modeling uncertain scenarios,
- comparing pessimistic, realistic, and optimistic cases,
- generating collaborative simulations, whether private or public.
It also enables risk quantification, in order to challenge subjective biases, whether they concern a single factor or complex multidimensional combinations.
3. What Is Compass Used for in Practice?
Compass offers multiple use cases across various sectors. Here are some examples:
- Strategic planning: assess how market conditions may affect long-term objectives.
- Budgets and forecasts: identify risks of cost overruns or potential delays.
- Resource management: simulate needs for different HR or logistics scenarios, anticipate shortages, or optimize allocations.
- Investment analysis: compare risks and potential returns between different opportunities by simulating market fluctuations.
4. How Does Compass Work in SAP Analytics Cloud
Let’s take a concrete example: a company specializing in bicycle sales wants to assess how different parameters can influence its margin. These parameters may include, for example, overhead costs, discounts granted to customers, or the cost of raw materials.
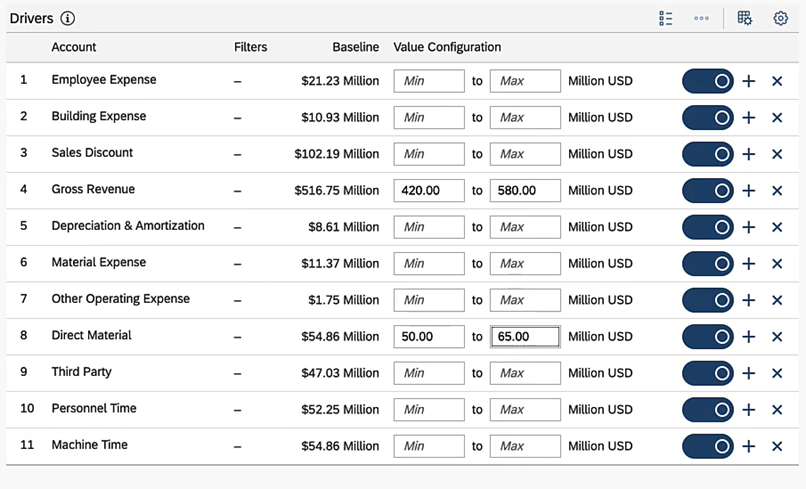
As illustrated below, the user begins by relying on the actual data available to date, called “Baseline.” This data represents the current state and serves as the starting point for the simulation. Then, through a feature called “Value Configuration,” the user can define variation ranges for each factor. This means they can simulate multiple scenarios by modifying, for example, the amount of discounts or the amount of personnel costs, in order to observe how these changes could affect the overall margin.
Once the parameters are defined, the user selects the number of iterations to run:
- 1,000 for a quick preview,
- 10,000 for medium precision,
- 100,000 for high-precision simulation.
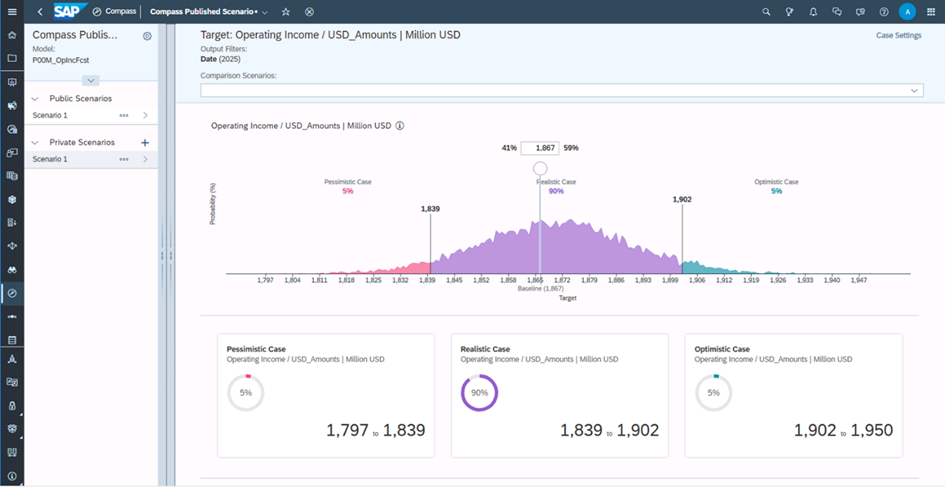
After clicking Run, SAC performs these random simulations and presents the result in the form of a readable chart, structured into three zones:
- 5% of the most favorable cases,
- 90% of realistic cases,
- 5% of the most unfavorable cases.
The user can thus visualize the probability of reaching (or not reaching) their objective and compare two scenarios to identify the one that presents the best potential with controlled risk.
5. Which Distribution Should You Choose?
The choice of distribution depends on the degree of uncertainty regarding the factor being analyzed:
- Normal: when variations are moderate and based on reliable historical data (sales forecasts, exchange rates, margins, etc.).
- Uniform: for highly uncertain or exploratory cases (new markets, poorly documented assumptions, projects still unclear).
6. Conclusion
With Compass, SAP Analytics Cloud makes advanced simulation accessible to everyone, without technical expertise, and enables companies to better understand uncertainty in order to make more informed decisions. This is a major step forward toward more intuitive and integrated predictive analysis.
At MeltOne, with technical and functional expertise, we support our clients in implementing SAP Analytics Cloud, from defining requirements to adopting the latest features.
We also remain at your side to keep you informed of technological developments in the SAP ecosystem through our articles and publications on LinkedIn.
Feel free to follow us to stay at the forefront of innovation.
Sources:
Using SAP Analytics Cloud Compass
General Release of SAP Analytics Cloud compass – SAP Community
Introduction to Monte Carlo Simulation – SAP Community
Let’s discuss your challenges and our solutions
Let’s talk about your project and discover how MeltOne can turn your challenges into concrete, high-performing solutions.