Anaplan and Power BI: A winning pair for connected planning
I – Anaplan and Power BI
Anaplan is an EPM (Enterprise Performance Management) solution that enables real-time collaboration, facilitating data modeling and planning for better decision-making.
To benefit from more data visualization options, Anaplan introduced Power BI connectivity. Thanks to the latter, users have the ability to visualize and interpret information through personalized reports using raw data from different sources.
II – Differences between Power BI & Anaplan
Two different but complementary tools
Anaplan and Power BI are two complementary tools whose functionality and use differ.
The Anaplan solution is designed to allow companies to connect and align their planning processes, manage data, and collaborate across departments and functions for better decision-making. Equipped with certain simulation and data visualization capabilities, its main objective is to create and manage financial plans, budgets, and forecasts of all kinds (sales, logistics, human resources).
Power BI’s main features are data visualization and reporting. It allows companies to connect to various data sources (internal or external), import and transform this data, and then create reports that can easily be shared and consulted.
| Anaplan | Power BI | |
|---|---|---|
| Tool Description | Cloud-based EPM Tool | Microsoft solution for data visualization and reporting |
| Data entry and calculations | Advanced data entry and calculations (simulation, scenarios…) | No data entry, simple calculations (addition, division…) |
| Data Visualization | Visualization of data imported and entered in Anaplan | Wide range of features, possibility of connecting to external data sources |
III – Why connect Anaplan with Power BI?
Thanks to this connectivity, users now have access to more ergonomic interfaces and more detailed visuals.
Here are some advantageous features of this extension:
Better efficiency with automated updates
No more need to switch from one interface to another; the extension allows real-time synchronization of dashboards and modules without having to manually perform imports via Anaplan.
Better visibility
By integrating Anaplan with Power BI, users can combine Anaplan’s planning and modeling capabilities with Power BI’s visualization and reporting capabilities. The many types of charts and visuals available provide a more complete overview of various activities.
Customized solutions
Power BI offers a wide range of possibilities for customizing dashboards and reports to best meet the specific needs of businesses. This also ensures better tracking of KPIs.
IV – Tool Integration
How to configure the tool in just a few steps?
The connector runs via Anaplan data integration APIs and allows Anaplan models to be loaded into Power BI. Before performing this integration, it is necessary to go through data preparation steps:
- Start by creating the different modules in Anaplan as well as the export actions for the data to be visualized,
- In Power BI, select Anaplan from the list of specific data connectors,
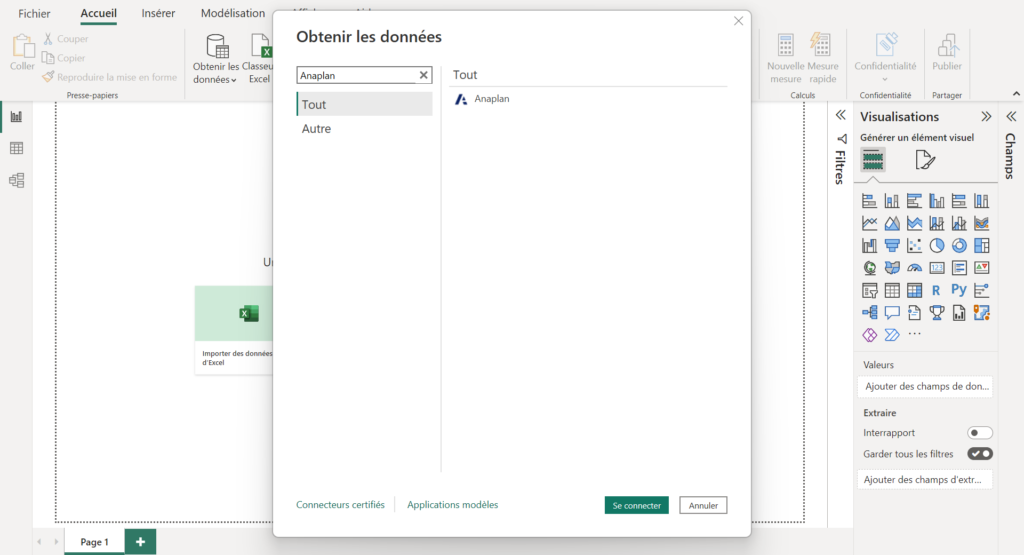
- In the Anaplan connector configuration screen, enter the API and authentication URLs:
Anaplan API URL: https://api.anaplan.com
Anaplan Auth URL: https://auth.anaplan.com
- Log in to Anaplan by entering your credentials,
- It is now possible to access the different Anaplan models and workspaces. You must ensure that you have export actions in Anaplan so that the connector can download the data from the model.
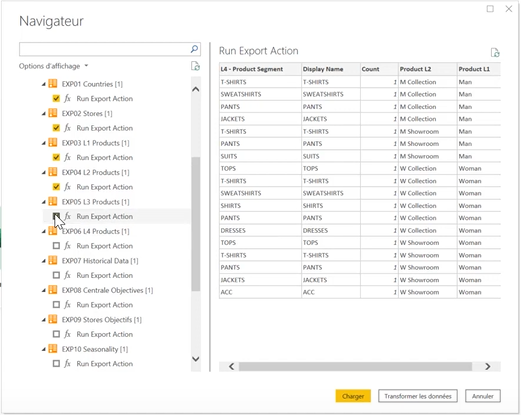
All export views are thus available in Power BI under the “Fields” tab. It is now possible to create personalized reports with the available data.
V – Advantages of Power BI in terms of Data Visualization*
One of the main advantages of Power BI and Anaplan connectivity is the automatic or scheduled data refresh. There are also other advantageous features specific to Power BI:
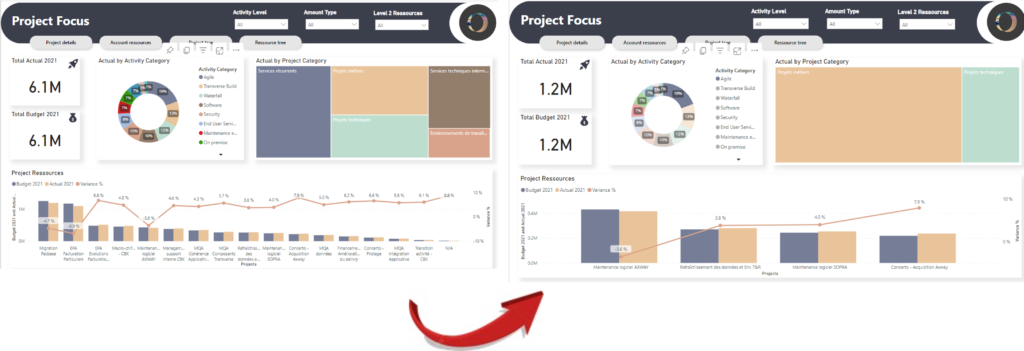
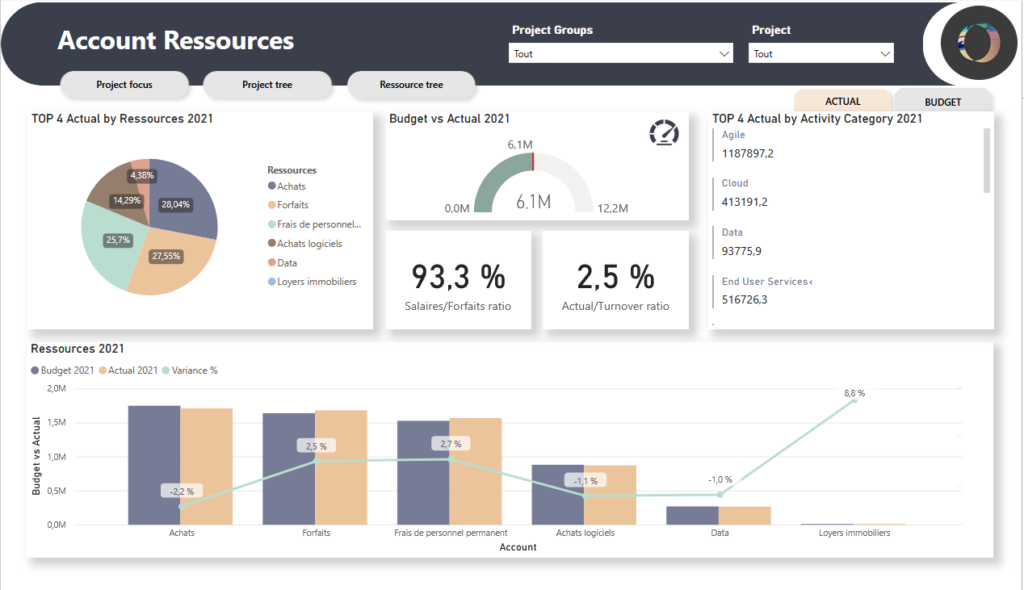
Interactivity of visuals
Data can be filtered by activity categories, for example. Simply click on a particular activity to view only the data related to that selection. This triggers synchronization across all visuals in the report.
It is also possible to highlight certain data to bring it to the forefront. This allows users to explore data more easily.
Diverse and varied visuals
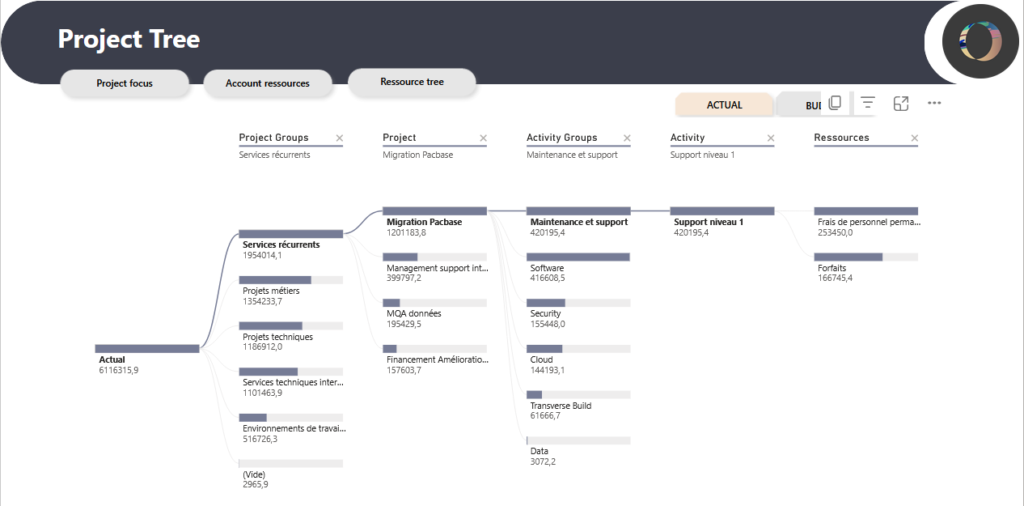
Power BI provides a wide range of options in terms of data visualization. These include charts, tables, maps, diagrams, and many others. This allows for a broader view of Anaplan data.
Large-scale deployment
Thanks to Power BI, it is possible to deploy reports and dashboards on a large scale.
Indeed, Power BI can be combined with several complementary applications such as Excel, Azure, Office 365, and Anaplan. This multitude of external data sources allows information to be processed and analyzed on a larger scale.
Better collaboration
It is possible to add comments, exchange notes on Power BI Service, and be notified of changes made.
*For more information on the benefits of Power BI in terms of Data Visualization, we invite you to consult our article Improving your CCH Tagetik data visualization with Power BI (bookmarks, drillthrough, drilldown, filters, etc.).
Without any particular technical expertise, Anaplan and Power BI connectivity is easy to configure. This extension allows for considerable time savings and autonomy in creating personalized dashboards and reports efficiently.
You can watch this short video to learn more:
To ensure better centralization and synchronization of your management, opt for Anaplan connectivity on Power BI. Our teams can support you. You can contact us to learn more at jsaccona@meltone.com
Let’s discuss your challenges and our solutions
Let’s talk about your project and discover how MeltOne can turn your challenges into concrete, high-performing solutions.