How can you boost your CRM analytics with Power BI?
Context
Salesforce is a Cloud CRM platform that provides a 360° view of your customers, enabling you to implement the actions needed to grow your sales.
Power BI is a data visualisation tool that enables optimal data interactivity.
Our business case? A client using the Salesforce CRM for customer data, as well as an SSAS cube for other types of data (sales, inventory, etc.), to which the Power BI solution was already connected for business reporting.
A recurring challenge: how can you leverage the various data sources already available in the company to feed comprehensive analyses that require combining customer data protected by a legal framework—namely in compliance with the GDPR—with sales data in particular?
We explain why and how to adopt Power BI in order to consolidate analyses that draw on all this data.
Why connect Power BI with Salesforce and other sources such as an SSAS cube?
There are many connectors provided by the Power BI solution, enabling live use or import mode for data available from various sources.
To address our business case, we therefore connected Power BI in import mode to Salesforce objects as well as to the SSAS cube, in order to retrieve customer data and sales data respectively. The data model is therefore built and enriched directly in Power BI. Here, the consolidated sales data in the cube contains only one piece of customer information: a unique ID that links this data to the customer master data from Salesforce, which uses the same unique ID.
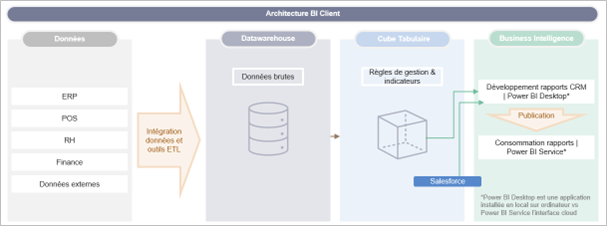
Once this model has been built in Power BI, it is possible to enrich the dataset with calculated indicators such as changes in the conversion rate, before publishing it online in Power BI Service so that different reports can be connected to it. As a “self-service BI” tool, Power BI puts business teams back in control of analysis and a better understanding of their activities, thanks to more impactful visualisation* and an ergonomic interface.
*We invite you to read our article Improve the visualisation of your CCH Tagetik data with Power BI to learn more about the benefits in terms of data visualisation (visual interactivity, bookmarks, drillthrough, drilldown, filters, etc.).
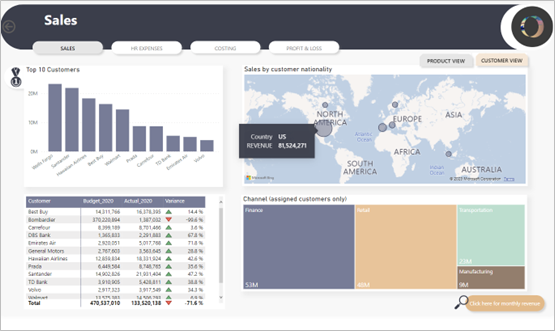
In our use case, consolidating a dataset that combines customer and sales data in Power BI enabled the creation and enrichment of KPIs (key indicators) that could not be created in their Salesforce CRM. In particular, this made it possible to historise a status for customers depending on the time period being analysed, and also to understand how the number of prospects who became customers evolved over the year.
Define the requirements, implement, and ensure the long-term sustainability of the adopted solution
It is essential to have solid foundations by supporting the detailed design phase of the new requirement. Challenge the business on how it uses the tools and data currently available, as well as on tomorrow’s challenges. The goal is to raise the most accurate level of information possible, so as not to weigh down the data model with unused data.
Data accuracy
A key factor in adopting the new solution is ensuring the functional completeness of the model. Combining different data sources implies a high level of responsibility in guaranteeing the data made available. Thorough testing must be carried out to ensure there is no discrepancy with the data available in the other tools already deployed.
Data security
What is the analysis scope? Who will the new reports be intended for? Should there be rules restricting access to certain data?
And speaking of restrictions, Power BI is ideal for configuring security rules at the dataset level. This avoids having to duplicate the same report intended for different user groups that should not have visibility over the same data scope. Indeed, it is possible to set up RLS (Row Level Security) and map a user or a group of users to it—for example, RLS applied at a geographic level so that CRM Europe Managers can only view sales for customers whose country of residence belongs to the Europe zone.
Business user adoption
Once the dataset has been put into production by the developer, it becomes the source for all future Power BI reports consumed and/or created by the CRM teams. They become increasingly autonomous in using the reporting solution thanks to an easy-to-use interface with extensive drag-and-drop of the various available elements.
Governance and enablement
Implementing solutions and providing access to new data is good; ensuring everyone has the same level of understanding of the applied business rules is even better!
Indeed, while business teams are becoming increasingly autonomous in creating reports and indicators, it is essential that all users are aware of the various specifics related to the data they use. Are there mandatory filters to apply depending on the KPIs being reviewed? Which sources feed each table in the model?
Ensuring the long-term sustainability of the solution also involves the day-to-day support provided to users to address their issues—from moderating a chatroom in case of questions or blockers, to providing a ticketing tool for new enhancement requests, for example. We offer a number of initiatives that have already proven effective with our clients, and we would be delighted to discuss them further with you.
Technical focus: How to connect Power BI to Salesforce data?
The link between Salesforce and Power BI is established in several steps, described below, via a simple connector. The full list of connectors available for Power BI depending on the sources used is available in this article in the Microsoft documentation.
Salesforce prerequisite: access to the Salesforce API must be enabled in your Salesforce profile settings.
- Open the Power BI Desktop application on your machine.
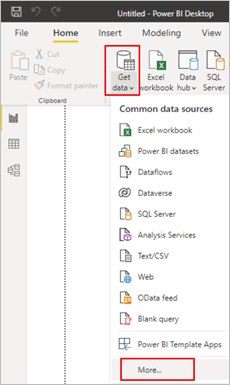
- Use the Salesforce connector by going to “Get Data” > “More” > “Salesforce Objects”
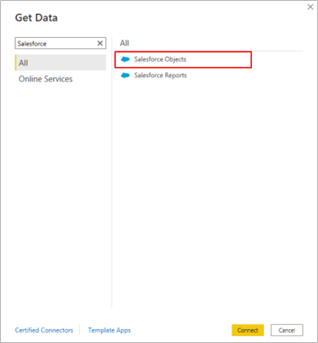
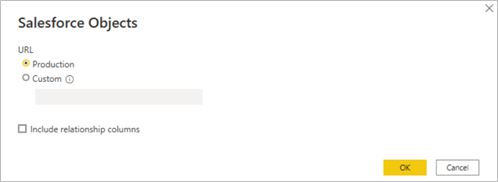
- Select either “Production” in the new pop-up to use the default connection link (https://www.salesforce.com) or “Custom” for custom links (https://company.salesforce.com), then click “Ok”.
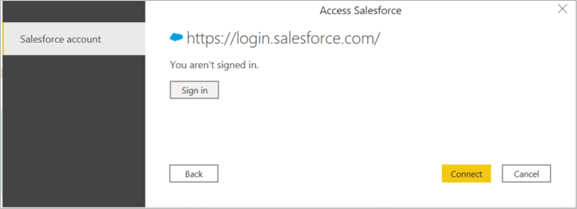
- Enter your Salesforce login credentials.
- Select the Salesforce objects you want to retrieve, then select either “Load” to load the raw tables directly or “Transform Data” to perform transformations in the Power Query editor, such as adding concatenated columns or changing the format of fields (date, text, etc.).
Considerations and limitations
- Ensure that the volume of imported data does not exceed the limitations shared by Microsoft Power BI, in order to guarantee good report performance.
- Import only the fields that will be used immediately. Do not import too many fields on the pretext of a potential future need that has not yet been identified.
- Check that the format of the fields available in Salesforce is supported at the time of import. E.g.: drop-down lists are not.
Are you interested in implementing Salesforce x Microsoft Power BI connectivity? Would you like to speak with our teams to identify whether Power BI properly meets your challenges?
MeltOne can support you across the entire value chain: from scoping to implementing or evolving the Power BI solution, through to delivering and/or co-delivering analyses in it.
Contact us!
Joan Saccona, Sales Director – jsaccona@meltone.com and Yohan Busidan, Data & Analytics Manager – ybusidan@meltone.com
Let’s discuss your challenges and our solutions
Let’s talk about your project and discover how MeltOne can turn your challenges into concrete, high-performing solutions.