Management Reporting, your new way of reporting!
Management Reporting is a new Anaplan feature available in the New UX since the July 2021 release.
It is a new presentation mode that allows you to create custom slides to provide key information and clear reports. Thanks to the flexibility of report pages, users can now quickly convert multi-page presentations to PDF format and easily share key indicators with various stakeholders.
But what exactly is it? What are the benefits of using Management Reporting? What would be the main use cases?
In this article, you will find not only a presentation of the main features, but also an overview of the Management Report creation and usage process.
Management Reporting, your new way of reporting
Integrated directly into the App section of your Anaplan Workspace,
“Report” is a new page type, in addition to the two existing choices: Board and Worksheet. Your report is stored in the Cloud on your Workspace, thus ensuring the availability of your report anywhere, anytime, without fear of forgetting or losing the document!
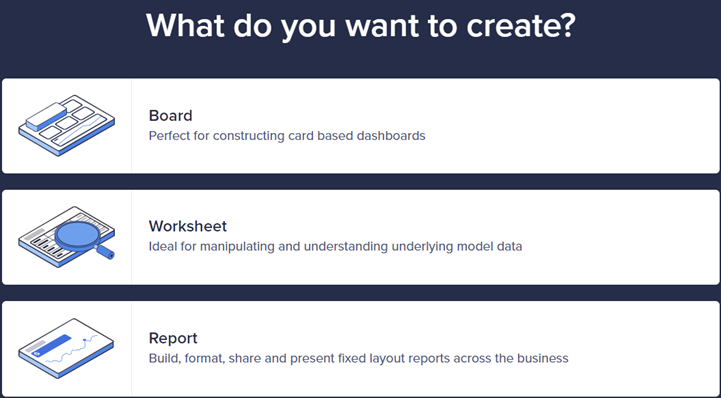
This new feature notably allows you to:
- Generate real-time reports:
The slides created are always synchronized with your Anaplan data. Consequently, users do not have to make manual modifications to the data, thus saving considerable time on their reporting.
- Communicate your point of view clearly and effectively:
Let your data speak with different styles, themes, and visualization modes, which allows you to have a clear presentation of your objectives.
- Adapt each report to its target audience:
The flexibility of reports allows you to customize slides according to the needs of each stakeholder: Communication for your affiliates, KPIs clearly presented for your decision-makers, or comprehensive reports for your statutory auditors.
As mentioned previously, one of the main advantages of using Management Reporting is to easily present your data to a particular audience type. The .gif animation below shows you where and how to create your first report:
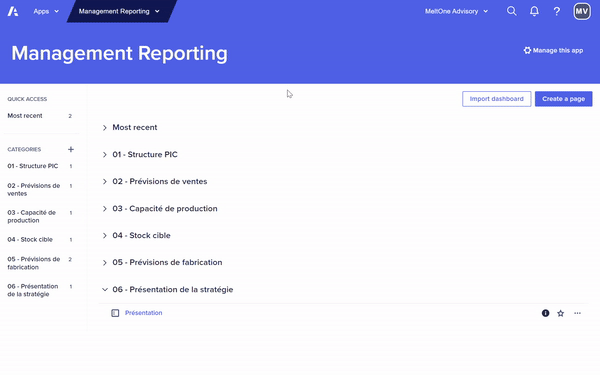
A practical example where the use of this feature would be relevant is the following: communicating your various KPIs (e.g., total expenses and detail by department) to your decision-makers.
A “Pixel Perfect” communication, in your company’s colors
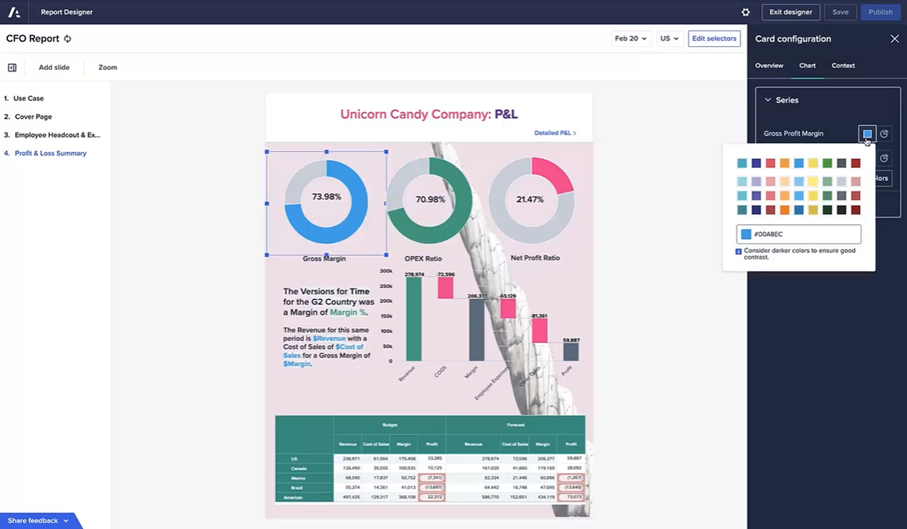
Each slide here is completely customizable. Display your own visual identity: logo, graphic charter, or your company’s theme. The novelty of Management Reporting lies in the possibility of stacking your customization elements.
Take advantage of thematic customization and the ability to overlay different cards to highlight the most significant indicators and show your audience what is important in your presentation.
Distribute unified communication and forget about poorly sized graphics, misaligned texts, or stretched images. Create a Pixel Perfect presentation!
A dynamic view, adapted to the chosen context
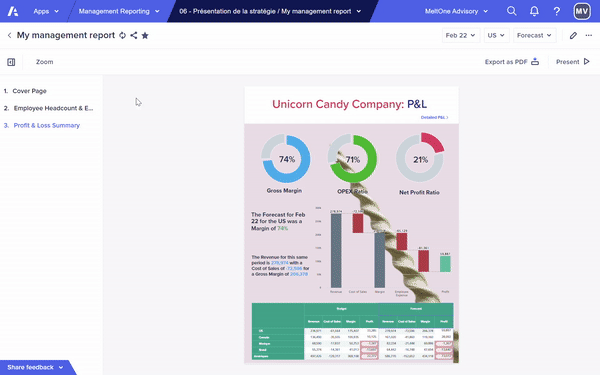
By pushing the customization of slides, we arrive at dynamic texts and graphics, thanks to the context selectors present at all times of your report’s cycle (Construction, Presentation, Export).
First, let’s remember that all figures displayed on your slide are directly linked to your data model. In short, the values indicated will automatically update according to the context chosen at the top of your page… With the exception that here, they are not modifiable: so no risk of accidentally deleting your data!
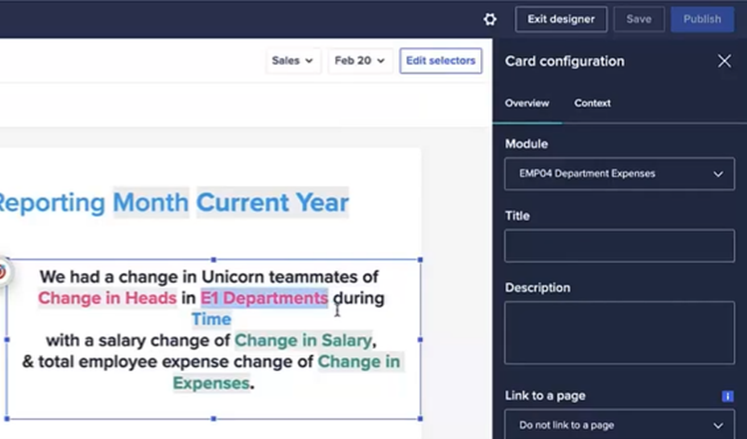
Important note, these selectors remain available even during the presentation of your report. You can therefore modify the displayed context at any time, either with the selectors or by directly clicking on the value to synchronize. Since the document is dynamic, you can change the year, region, or other predefined values live, without having to prepare multiple slides in advance.
Save time on your presentations thanks to your dynamic and ready-to-use slides!
Export only what you want
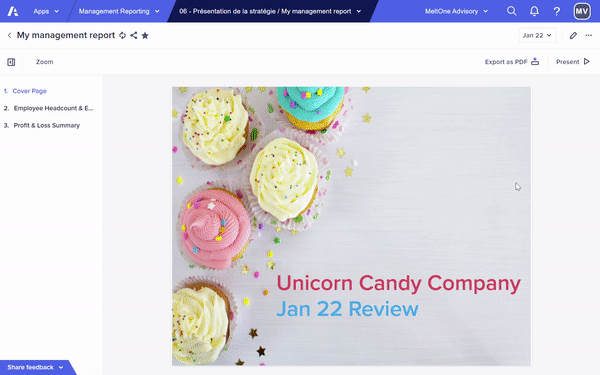
Find all your reports wherever you are thanks to cloud storage in your own Anaplan Workspace. But if you wish to communicate your report by email, it is also possible to export it in .pdf format, easily, directly from your presentation.
It is also possible to select the context at any time in the report. Export your entire presentation according to a particular scenario, or choose to export a set of specific pages.
No need to move your graphics or text boxes again. Create your slides once pixel-perfectly and then enjoy a unique presentation that will adjust according to your needs or your audience. Management Reporting facilitates communication with your decision-making contacts or with those who need quick and clear data control, such as your audit bodies or your top management.
Find below how to easily export your Management Report in .pdf format
In conclusion, Management Reporting simplifies the reporting process with Anaplan. Find your most recent data with the ability to switch between different scenarios during a presentation thanks to the context selectors directly present at the top of the page. Enjoy user-friendly customization of your pages with easy-to-implement images or graphics and many other features!
So don’t wait any longer and start building your next Reports today!
Are you already using Anaplan, and would you like to know more about Management Reporting? We are available to assist you. Feel free to contact us at cmaurice@meltone.com or jsaccona@meltone.com
Let’s discuss your challenges and our solutions
Let’s talk about your project and discover how MeltOne can turn your challenges into concrete, high-performing solutions.