AI as a Bridge Between Business and IT: When Hybrid Agent Networks Reinvent Data Analysis
How artificial intelligence finally enables business and IT teams to speak the same language, without compromising speed or security?
Discover how MCP works in practice in this video with Camille Maurice, D&A Director at MeltOne
The Challenge: Two Worlds Struggling to Understand Each Other
On one side, business users face growing pressure. Decision cycles are accelerating, analysis requests are multiplying, and the ability to quickly answer an operational question has become a competitive advantage. But to get an answer, they often need to formulate a technical requirement, wait for a developer or BI analyst to translate it into a query, then validate the result. A process that can take days, even weeks.
On the other side, IT teams carry an equally critical responsibility: ensuring data security, model reliability, compliance with access policies, and semantic consistency of indicators. Every uncontrolled tool deployed by a business user (the infamous shadow IT) represents a risk: unreliable data, security vulnerabilities, loss of traceability.
What AI Changes in Practice
For Business Users
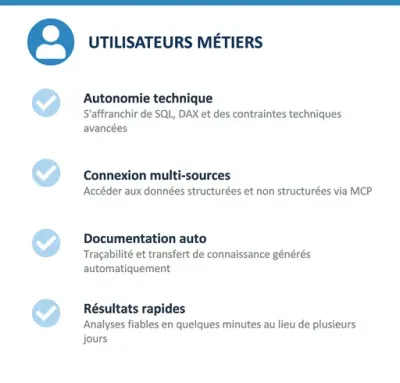
Breaking free from technical constraints without sacrificing reliability. Business users no longer need to master SQL, DAX, or the intricacies of a data model to obtain relevant analysis. They express their need in natural language, and AI translates this request into technical actions—queries, transformations, visualizations—relying on business definitions validated by the organization.
Connecting to multiple sources transparently. Through MCP (ModelContextProtocol) protocols and APIs, AI can simultaneously query structured databases, semi-structured files (Excel, CSV), and unstructured sources (emails, documents), all within a secure framework. Users don’t need to worry about the technical plumbing.
Automatically generating documentation. Each analysis produced by AI can be accompanied by clear documentation: which data was used, which transformations were applied, which assumptions underpin the results. This ensures knowledge transfer and traceability.
For IT Teams
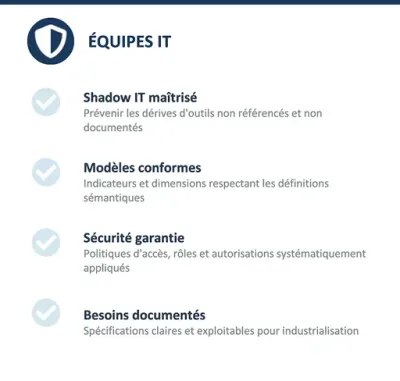
Preventing shadow IT risks. When business users have a fast and reliable channel to obtain their analyses, the temptation to create parallel Excel files or use unapproved tools decreases significantly. AI channels usage within a controlled ecosystem.
Recovering Compliant Data Models
AI relies on the semantic layer defined by IT. Indicators, dimensions, and calculation rules respect official definitions. No homemade KPIs whose formula nobody knows.
Ensuring Enforcement of Security Policies
Data access goes through existing roles and permissions. AI doesn’t open a backdoor: it operates within the framework of existing permissions.
Receiving Clearly Formulated and Documented Requirements
When a business user interacts with AI to build an analysis, the process naturally produces a structured trace of the requirement. IT thus has an implicit specification, usable to industrialize or evolve the solution.
Overall diagram
Concrete Illustration: Comparability Analysis of a Store Network
Before: Manual Steps Involving Multiple Teams

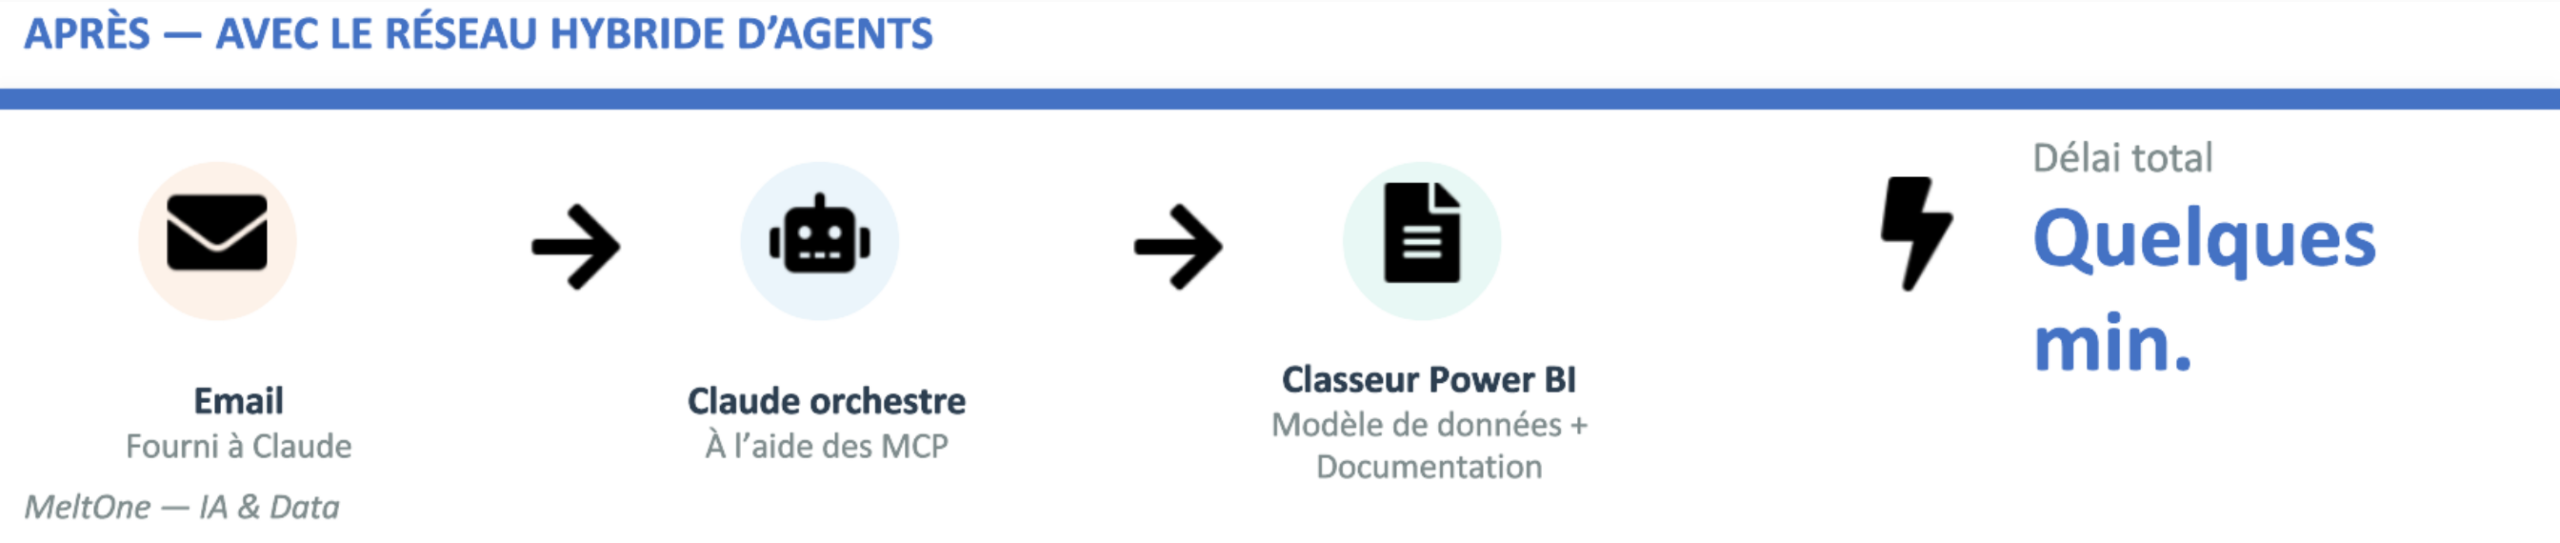
After, with a Hybrid Agent Network: The Same Workflow in Minutes and Autonomously
-
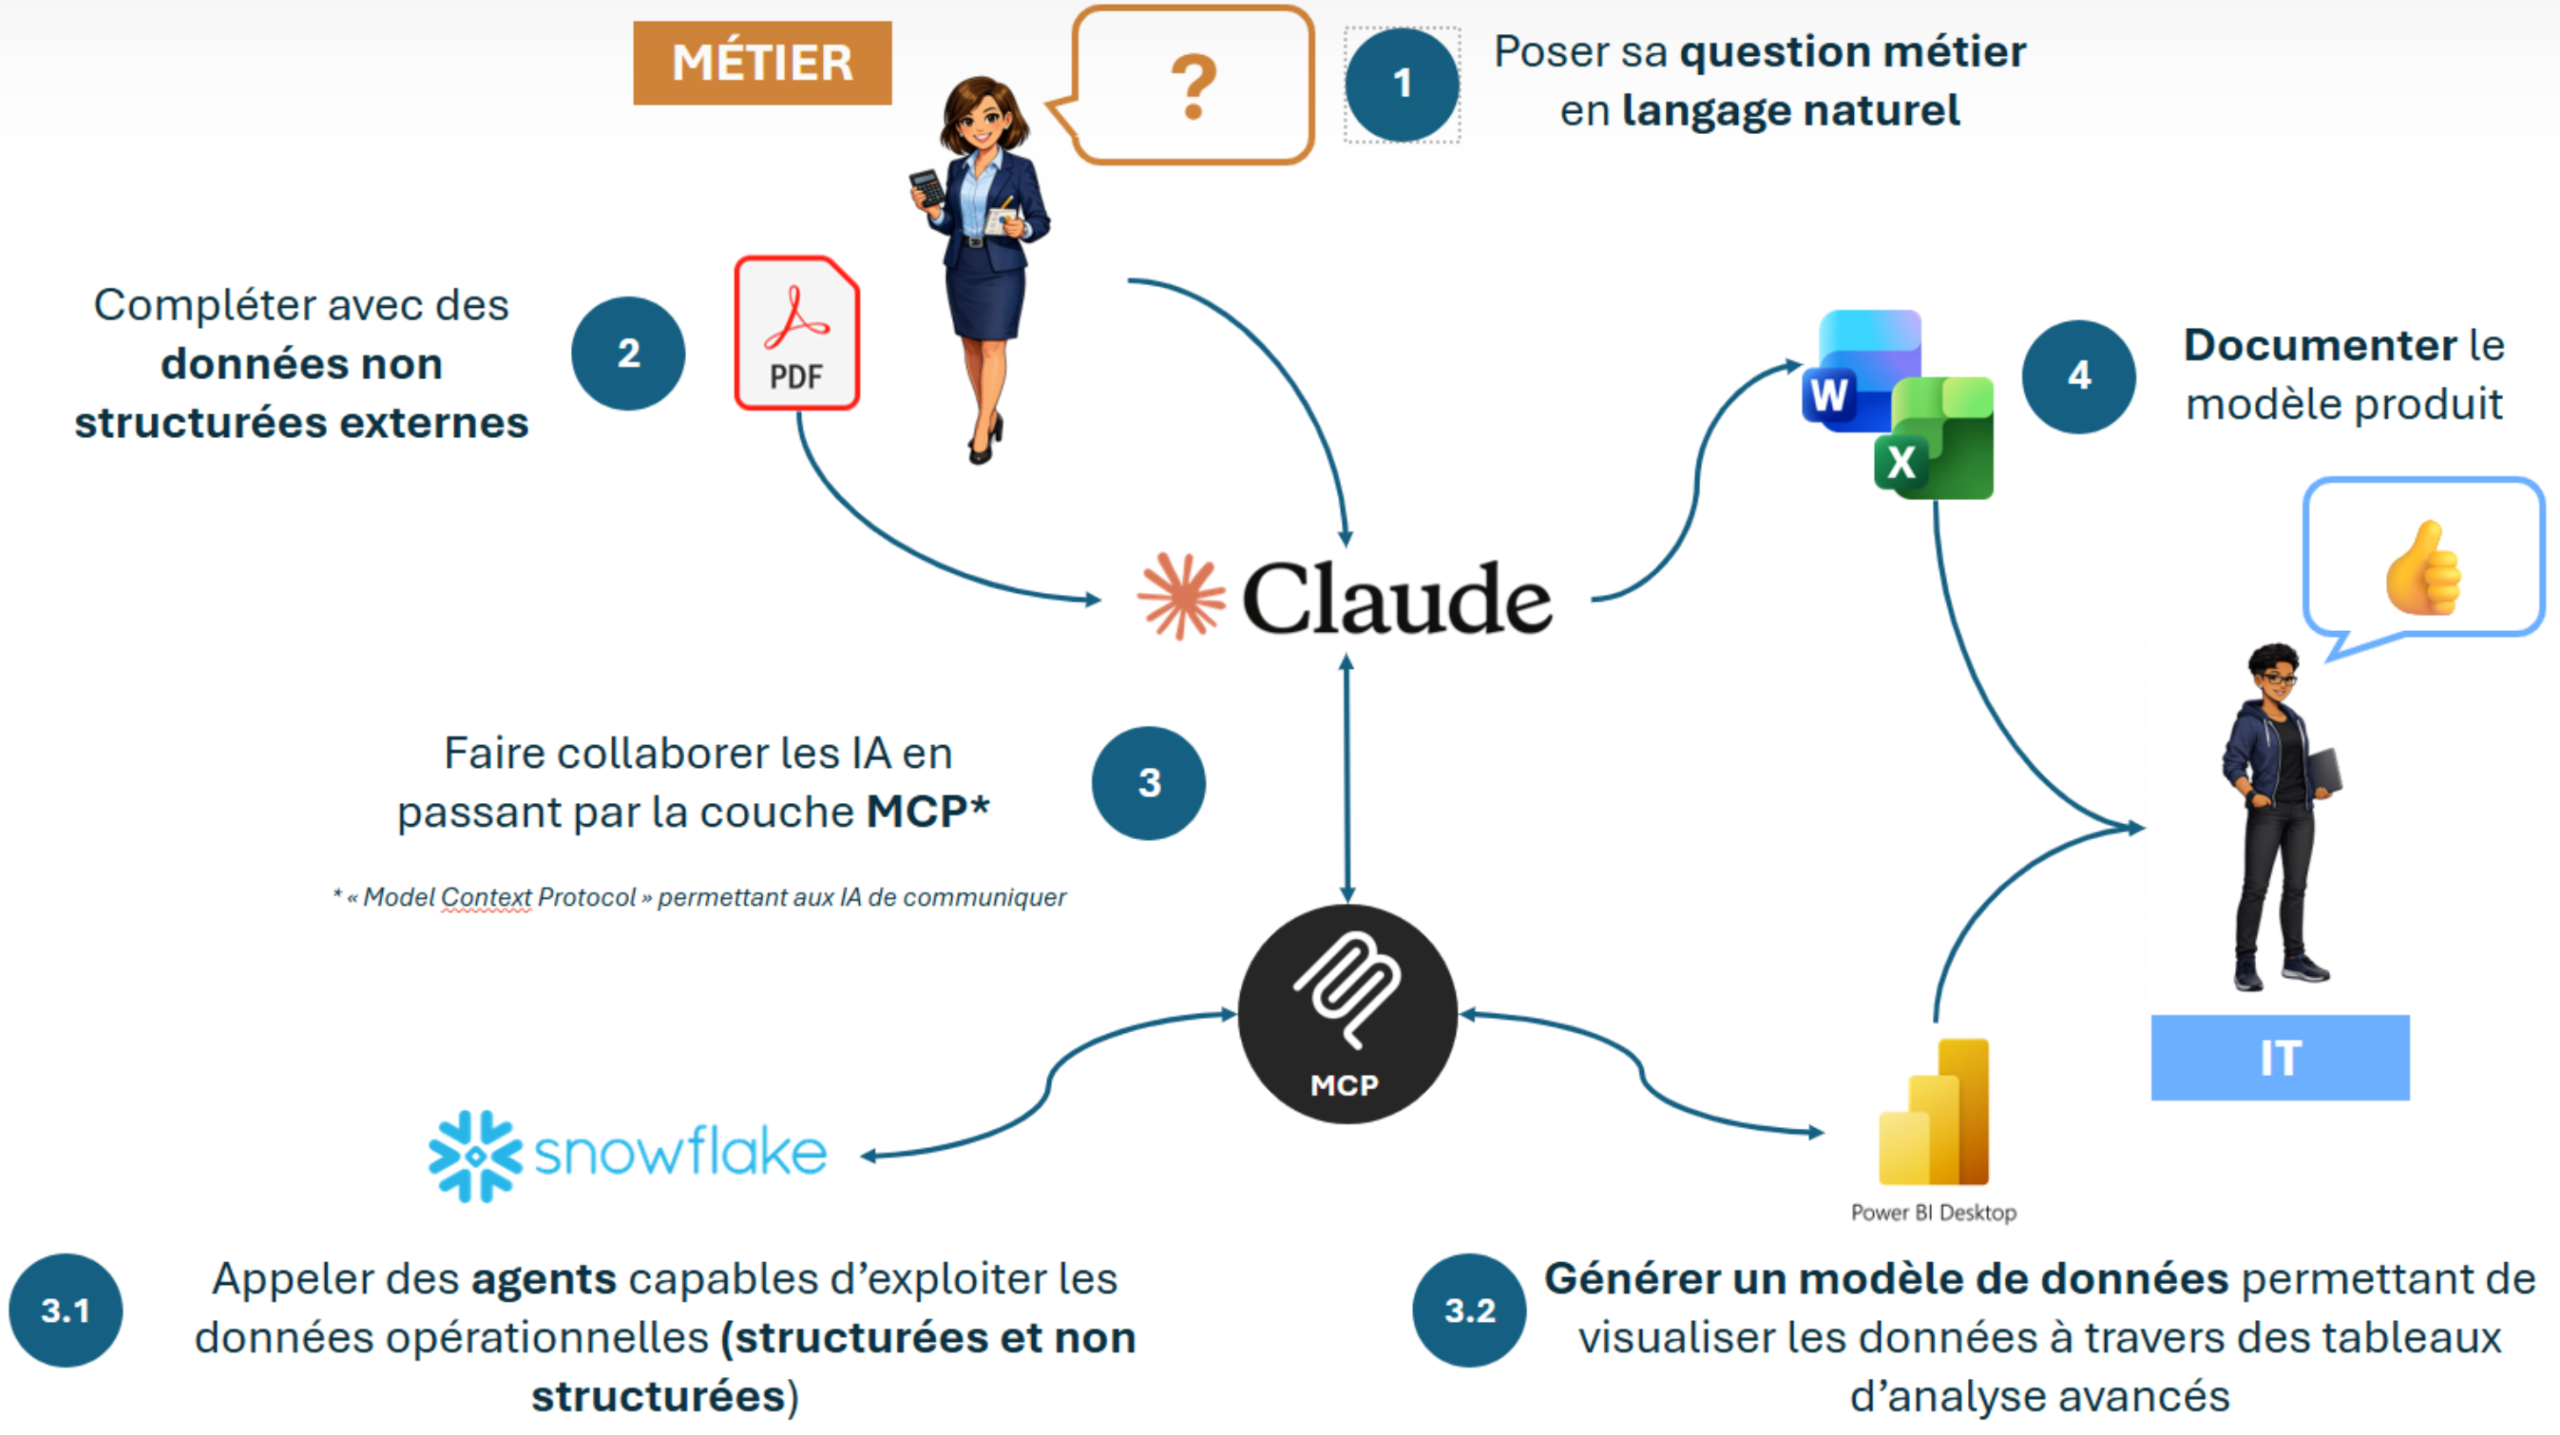
Step 1—Understanding the requirement and retrieving email data.
The user provides Claude with the file received by email containing the list of stores under renovation. Claude reads and interprets the content, identifies the stores concerned, renovation dates, and associated information. -
Step 2—Connecting to Snowflake via MCP.
Claude queries Snowflake Cortex agents to retrieve sales data for the identified stores. It relies on the semantic layer to use the correct indicators (net revenue, comparable revenue, number of transactions…) with their official definitions. Snowflake roles and permissions apply normally. -
Step 3—Cross-referencing and analysis.
Claude cross-references renovation data with sales data, identifies comparability periods, and builds the requested analysis: comparison before/during/after renovations, by geographic area, by store type. -
Step 4—Generating the Power BI workbook.
Claude generates the data model and necessary DAX measures, then creates the Power BI workbook directly on the user’s workstation. Visualizations are ready to use. -
Step 5—Automatic documentation.
The entire process is documented: data sources used, transformations applied, comparability assumptions retained. This documentation is usable by both the user and the IT team.
Let’s discuss your challenges and our solutions
Let’s talk about your project and discover how MeltOne can turn your challenges into concrete, high-performing solutions.