Improve your CCH Tagetik Data Visualization by connecting to Power BI
2 Tools, 2 Ways of Consuming Data, 1 Unified Solution!
Take CCH Tagetik data visualization to another level by making the most out of the connectivity offered with Microsoft Power BI.
-
CCH Tagetik and Power BI
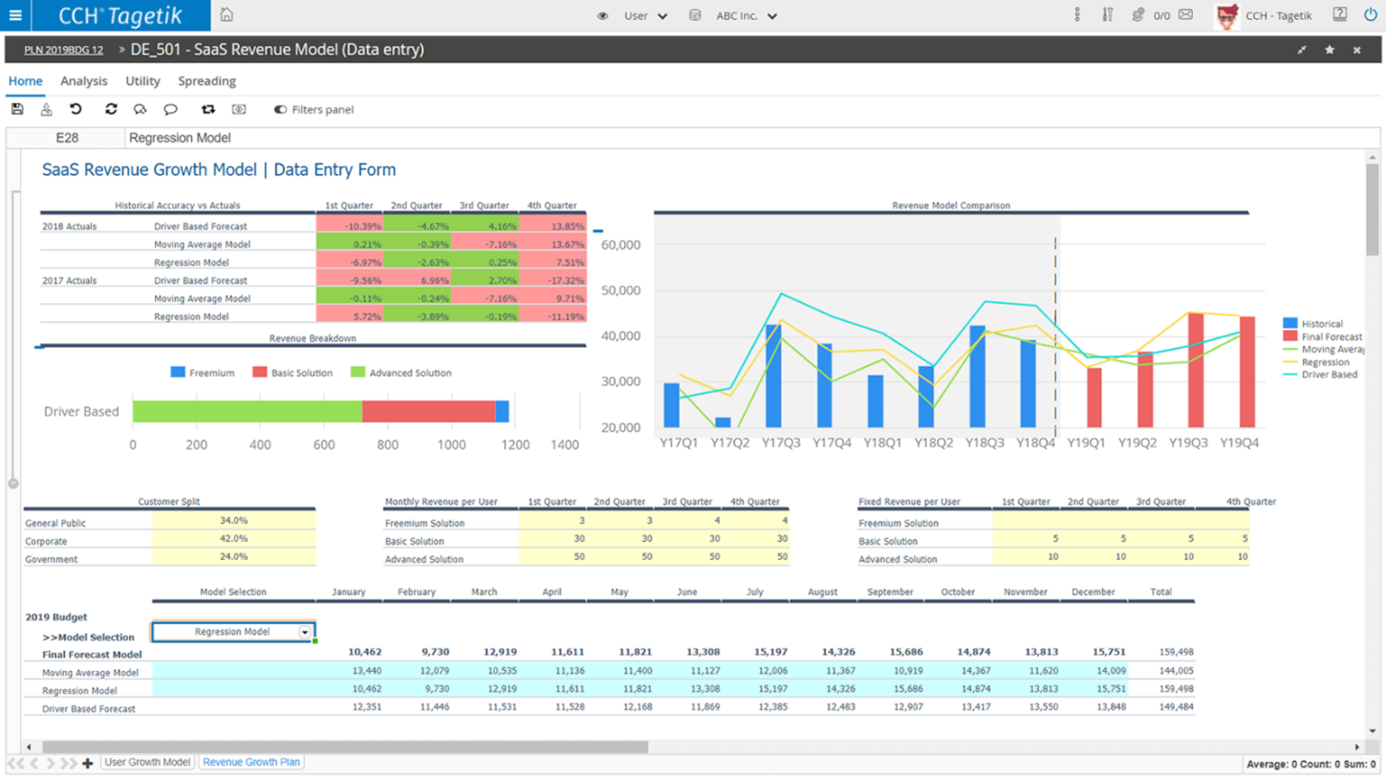
CCH Tagetik is a Corporate Performance Management software dedicated to business users. The solution is built with different environments, such as development and production, which group together several applications. CCH Tagetik allows you to plan your operations more precisely as well as to visualize, in the blink of an eye, the results and their impacts on your business.
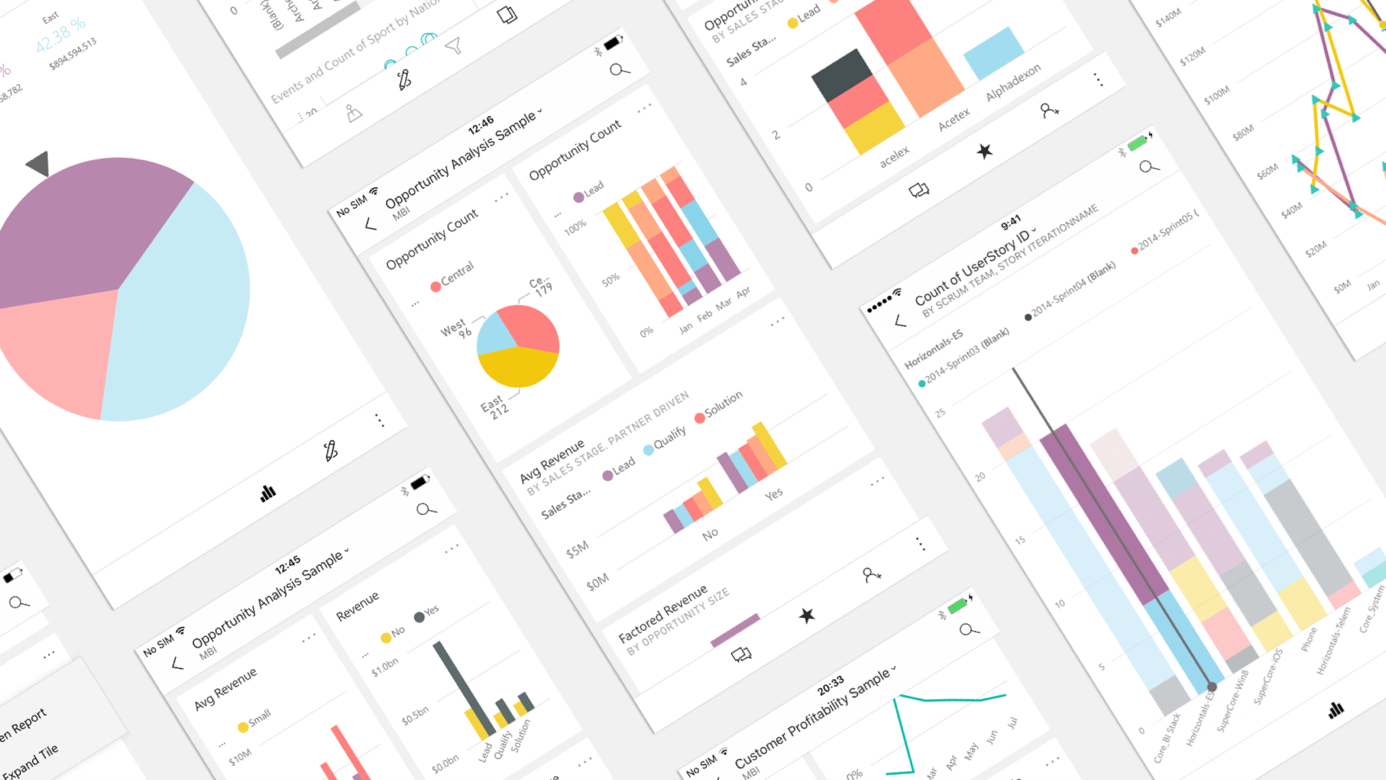
Developed by Microsoft, Power BI is a data visualization tool that offers optimal data interactivity. Its user-friendly interface can be quickly adopted by everyone to analyze data efficiently and optimize decision-making.
Because of their strong complementarity we recommend connecting CCH Tagetik with Power BI and go even further in the understanding of your data and allow holistic analysis of your business.
This article seeks to demonstrate the added value and the simplicity of connecting the two tools.
-
Why connect Microsoft Power BI and CCH Tagetik?
As a “self-service BI” tool, Power BI empowers users in conducting their own analysis and thus helps them better understand their activity. Thanks to a “no code” tool and an ergonomic interface, it’s no longer necessary to go through IT teams to add a new indicator or a new visual in a report. With data visualization being more impactful, decision making becomes more accurate and faster.
As a few examples, it is possible to set up flags in your visuals (through conditional formatting) in order to monitor at best the KPIs that have a true impact on your business management. It is also possible to switch from macro views to more detailed views at a glance to dig into precise analytical points (through bookmarks, tooltips, drill down etc.).
-
What are the benefits of Power BI in terms of Data Visualization?
The features described below constitute a non-exhaustive list of advantages.
-
Interactivity of the visuals
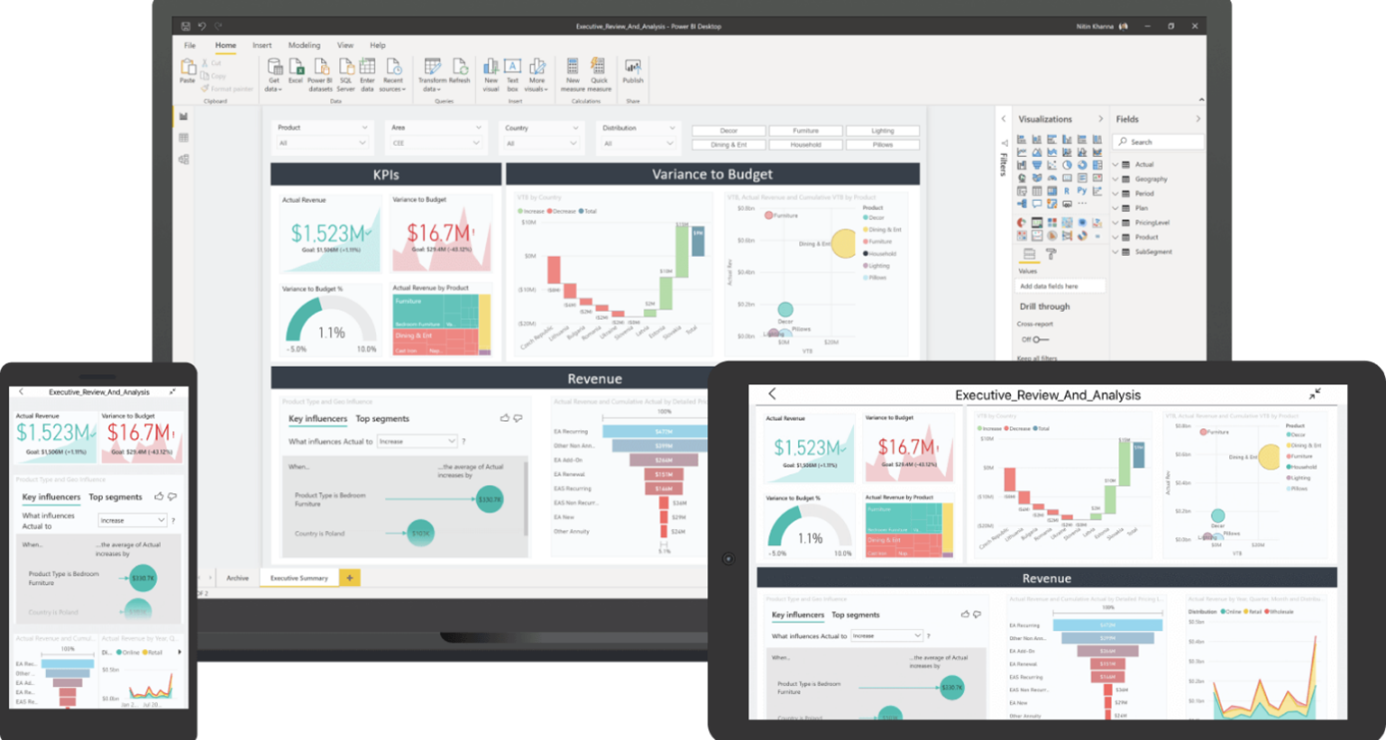
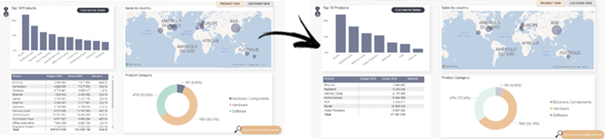
Power BI offers the possibility to manage interactions between visuals within the same page. In a Power BI report, when clicking on a category present in a visual, we have the possibility to either impact/filter/highlight the data on the other visuals within the page, depending on the parameters chosen. In the following example, the “Hardware” product category is selected in the donut chart, which filters the other visuals on the products that belong to this category.
2. Obtain more details in Power BI
Sometimes visuals cannot transmit all the desired information. Sometimes when too much data is displayed, it can make them unreadable. How can we mitigate these issues?
Power BI makes it possible to obtain different levels of details in a few ways.
Bookmarks enable the ability to switch from different views on the same page through the use of action buttons. Hence the purpose of bookmarks is to enable multiple dimensions on a unique page in order to prevent duplication. Some visuals can be added or hidden from one bookmark to another and can also be ordered/filtered differently.
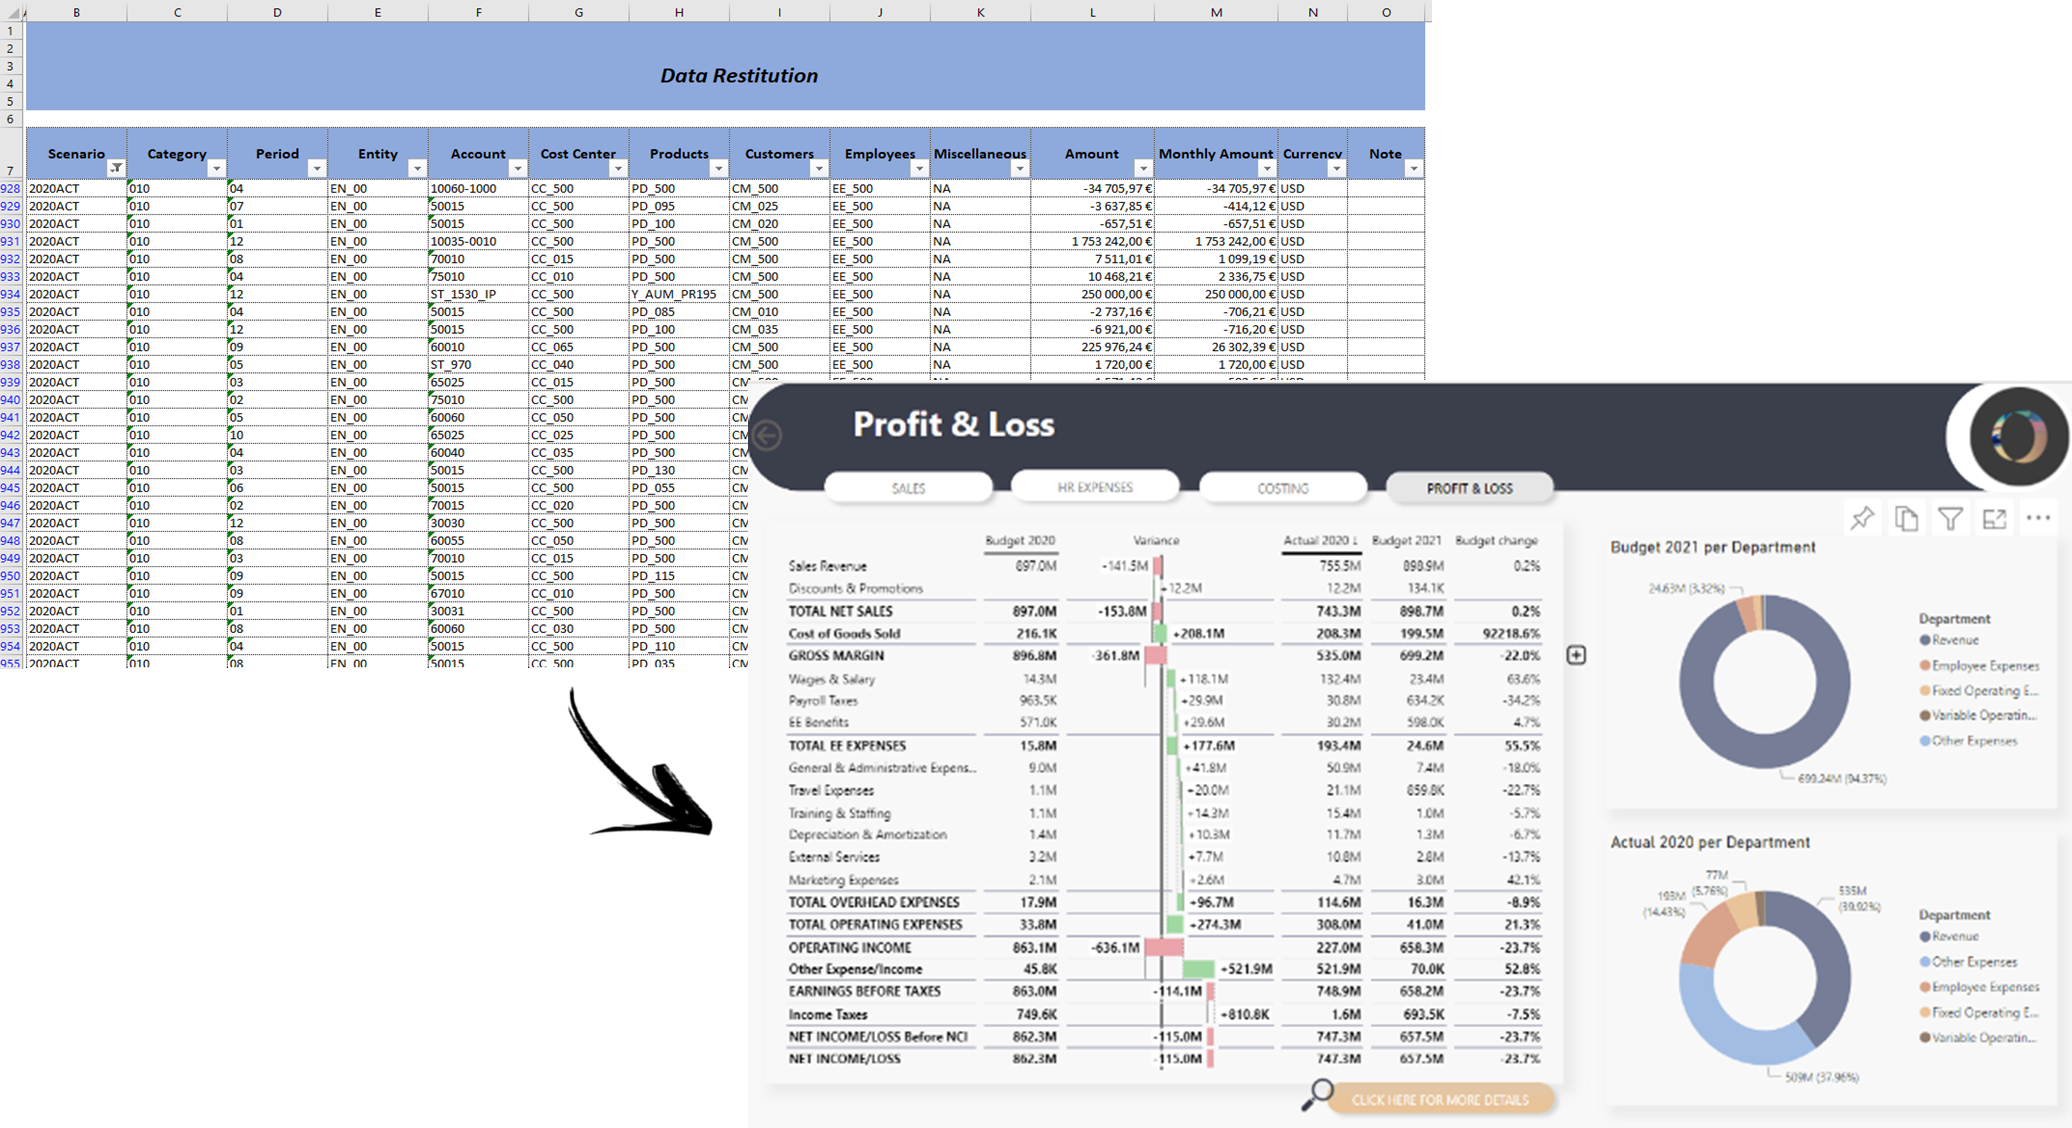
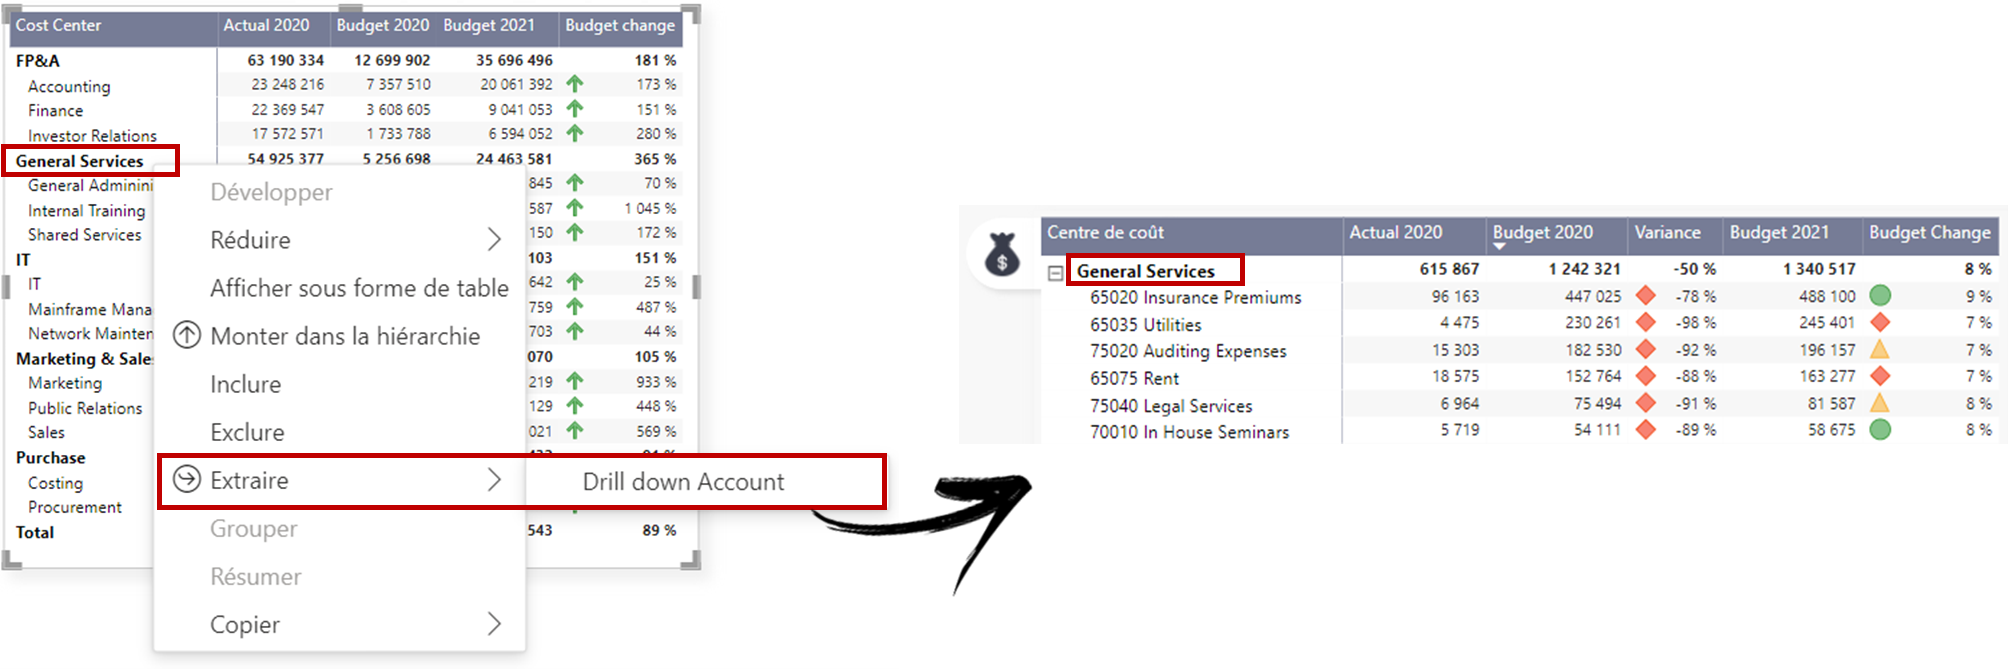
Drill throughs redirect you to a new page in the report, based on a specific data segment (a client, a cost center, a supplier, etc.). By right clicking on part of a visual, a user can delve into more detailed data based on that specific segment. This will give the user access to a new page, filtered by the context of the data point selected in the original visual. In the example below, the extract gives us the details of the accounts associated with “General Services”.
Using navigation buttons: Each page created in a report can be hidden. It is thus possible to create a page with the purpose of giving more details to a source page by linking them via a navigation button. By hiding the detailed page, it will only appear if the user goes through the navigation buttons set up, enabling access to a more detailed view on demand.
3. Custom and AI Visuals
Power BI offers a large panel of native visuals covering the majority of analysis goals. In addition, it is possible to download new visuals from the visual library catalog.
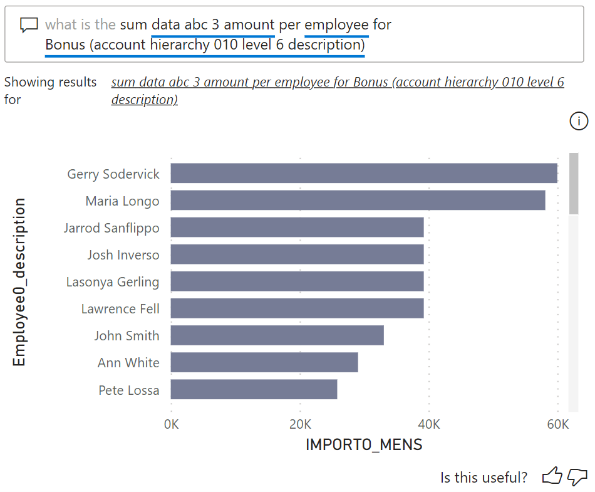
Furthermore, Power BI offers the possibility to use embedded AI visuals. This is the case for the Question and Answer visual above for example. When the user types a question, it responds by creating the most adapted visual on demand. In order to optimize responsiveness, synonyms can be set up for each field available, making it more fluid to use for collaborators.
-
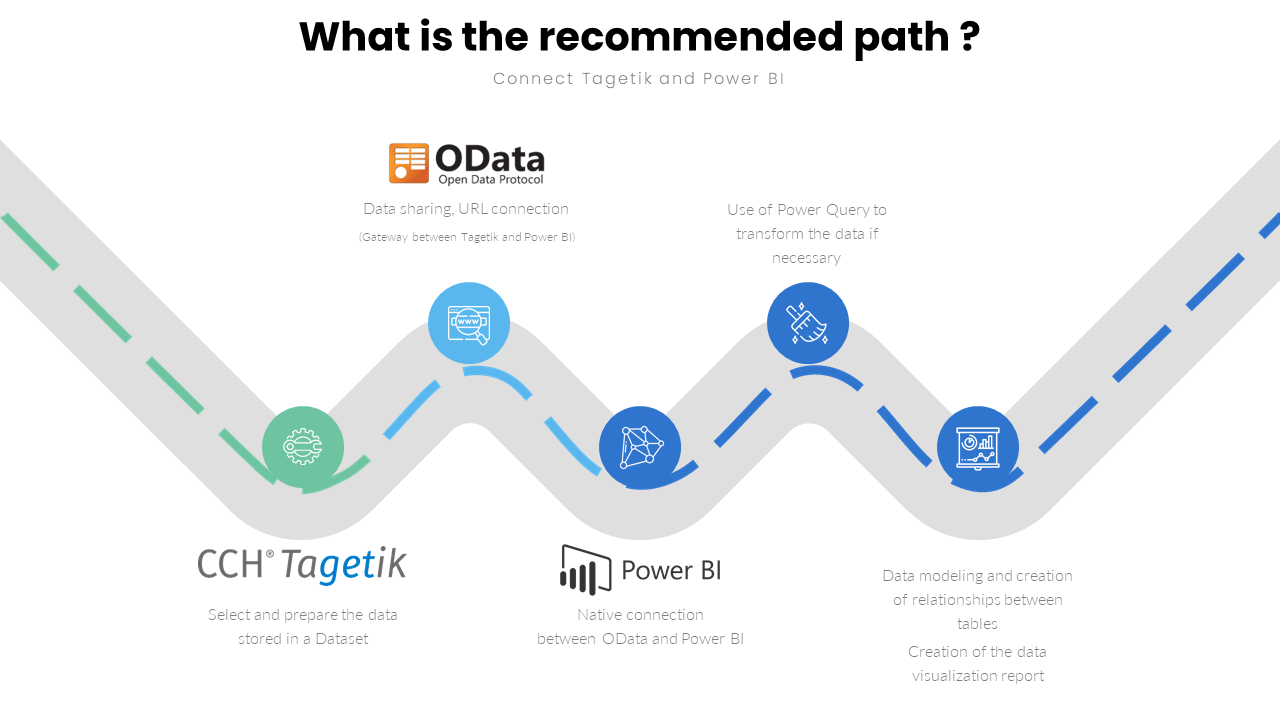
Data preparation and collection in CCH Tagetik
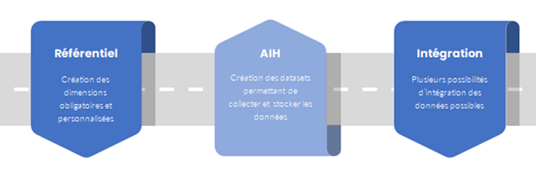
Data preparation enabling the communication and transfer to Power BI can be done in a few steps in CCH Tagetik.
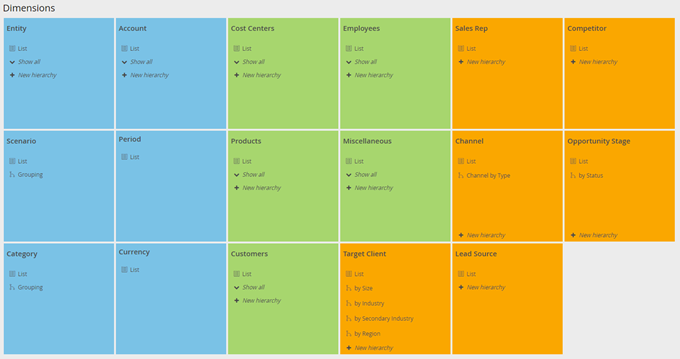
- First you need to create a repository composed of dimensions. Some of them are already present by default in the system. CCH Tagetik gives you the possibility to add up to 5 custom dimensions.
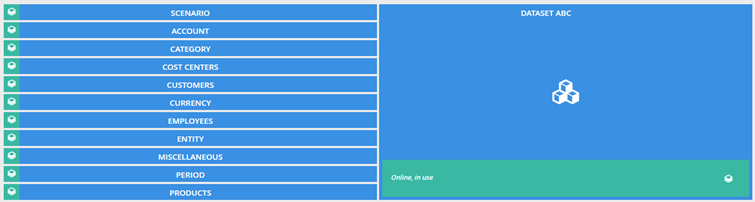
- Second, it is necessary to create datasets relying on the CCH Tagetik repository and allowing the collection and storage of data.
- Data can be integrated in CCH Tagetik in a few ways: via an ETL (Extract, Transform, Load), manually in the amount tables directly, manually via collection status or via the Quick Data Loader, or the tool present in CCH Tagetik that enables the import of data in a simpler and more flexible way.
- Once the data has been integrated in CCH Tagetik, a link must be made with Power BI through the OData feed which is a protocol that enables queries to be run and data modification operations. The OData feed being a standardized service makes it compatible with a vast number of applications. The connection is facilitated through the use of an URL.
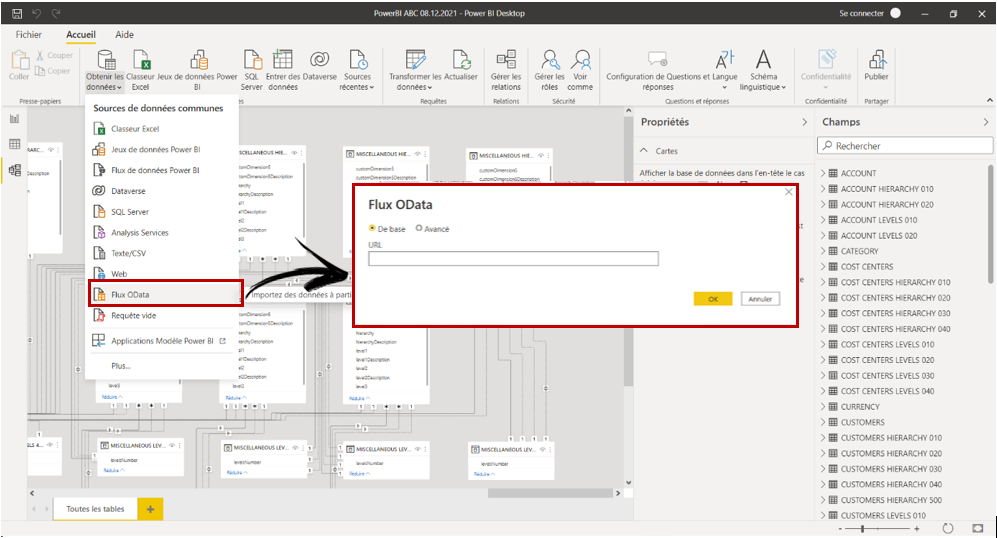
Each segment of the URL partitioned by an “/” represents a resource type in the entity model. It is essential to follow the appropriate syntax in accordance with the data we want to import.
As we can see in the above example, the filled URL allows you to select and retrieve only the data from the 010-hierarchy linked to the Account dimension present in the following data model: http://{serveur_tagetik}:{port}/tagetikcpm/api/datamodel/v0/account/TGK_01/hierarchies/010
These are just a few of the functionalities offered by Microsoft Power BI. Its features will allow your organization to perform powerful data analyses through a simplistic and efficient platform, which in turn will give you deeper insight and visibility in your reporting efforts.
Are you interested in implementing the CCH Tagetik x Microsoft Power BI connectivity? Do you want to interact with our teams to see if Power BI is the right match for your challenges?
If this article caught your attention on the use cases you might encounter within your organization, our teams will be delighted to talk with you about the connectivity between CCH Tagetik and Power BI.
MeltOne can accompany you throughout the entire value chain: from the qualification, implementation, evolution of your CCH Tagetik solution, and the implementation of the connectivity with Power BI up to the production and/or coproduction of analysis in this tool.
We can accompany you! We will be thrilled to respond and work with you as soon as possible.
Thomas Chamant, US Director – tchamant@meltone.com